Why Do Most Traders Prefer Technical Analysis Over Fundamental Analysis?
In 1989, Jack Schwager published a book called Market Wizards.
- Digitex Has Been Two Years in the Making - November 27, 2019
- Digitex Futures Is Ready to Revolutionize Futures Trading - November 26, 2019
- With 4 Days to Go, Check Out the Progress on the Digitex Testnet - November 26, 2019
In 1989, Jack Schwager published a book called Market Wizards. The book was based on a series of interviews that Schwager conducted with several of the most successful traders in the world. All the traders in the book had one thing in common; it took many years of practice to become profitable and successful. Each trader admitted to losing money for the first several years of their trading careers. In terms of trading styles, the traders developed their own unique approach to trading the markets. Some of the traders focused on fundamental analysis. However, the majority of the traders focused on technical analysis.
Schwager’s book verifies the fact that most traders and investors prefer using technical analysis over fundamental analysis. If the best traders in the world are using technical analysis, it’s probably safe to assume that this type of approach is more profitable than fundamental analysis. So, what is the difference between technical analysis and fundamental analysis? More importantly, why do the world’s best traders prefer to use technical analysis? Let’s examine the details.
Fundamental Analysis Versus Technical Analysis
As I’ve covered in a previous post, Fundamental analysis is particularly used in the stock market and especially when traders invest in individual stocks. Fundamental analysis focuses on elements such as price-to-earnings (P/E) ratio, earnings per share (EPS), debt-to-equity ratio, and dividend yield.
Its main purpose is to calculate the intrinsic value of the individual stock. That means looking beyond its price and determining its real value. For example, a stock that is trading below its intrinsic will be particularly attractive for an investor to buy.
Fundamental analysis is also used in other asset classes, such as commodities, bonds, and alternative investments, always with the same objective: to determine the value of the underlying asset. When the asset is trading below its intrinsic value, investors would be inclined to buy, as it would be considered undervalued.
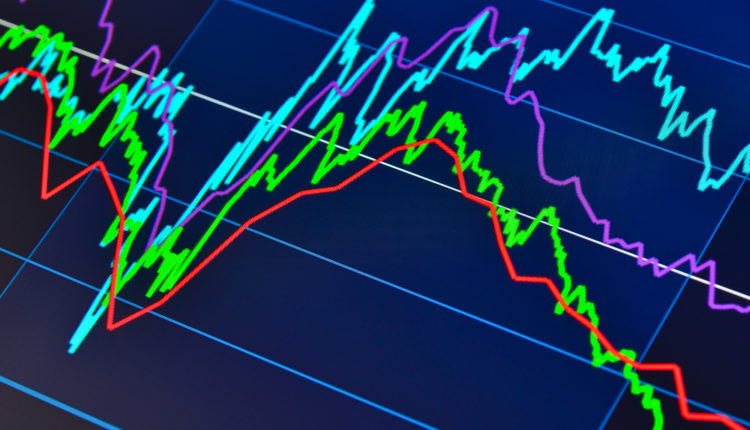
Technical analysis, on the other hand, uses a completely different method. It’s more of a trading approach designed to evaluate opportunities and investment flows by analyzing trends and statistics. These statistical trends are taken from different types of trading activities, most notably of all volume and price movement.
The intrinsic value is not important when it comes to Technical analysis. Rather, this approach focuses on patterns uncovered from various types of charting tools and price movements with the goal of assessing the strength or weakness of the underlying asset class.
Although technical analysis can be used with any asset class, it is most widely used among currency and commodity traders. Why? Because historical research suggests that currencies and commodities generate much better performance results when traders use trend-following tools commonly found in technical analysis.
Why Do Most Traders Prefer Technical Analysis?
Based on surveys conducted by brokerage firms and various research groups, approximately 70% of all traders use technical analysis instead of fundamental analysis. The percentage is even higher among professional traders. Schwager’s book is a perfect example. Among all the traders Schwager interviewed, less than 20% used fundamental analysis.
The main reason traders migrate toward technical analysis is because it’s very difficult to obtain fundamental data on a real-time basis. By the time the fundamental data is released to the general public, the information is usually stale and outdated. In other words, the information has already been factored into the price of the underlying stock or commodity.
A good example of fundamental data are the various government economic reports that are released on a regular basis. These reports include such information as the country’s unemployment rate, the rate of inflation, the country’s economic growth rate and the number of goods and services sold to other countries.
These reports are very helpful in determining the health of each country’s economy. More importantly, this data has the potential to dramatically move the price of stocks and commodities. All traders definitely pay attention to these reports when they are released to the general public.
Although this fundamental data is very important to traders and investors, most traders will argue that these economic reports are not very helpful in terms of improving their trading results. Why? Because the reports are often based on data that is two to three weeks old. Consequently, the information does not lead to new price discovery.
In addition to government economic reports, other fundamental data are also released. This would include such things are crop reports, cattle reports, energy reports as well as earnings reports from publicly traded companies. All this information falls under the umbrella of fundamental analysis.
Successful Traders – Jim Rogers
Without question, Jim Rogers is one of the most successful commodity traders of all-time. Rogers became extremely wealthy trading commodities primarily during the 1970s and 1980s. He was featured in Schwager’s Market Wizards book.
Rogers was completely different from most traders featured in Schwager’s book because he traded purely on fundamental data. He made all of his trading decisions based on fundamental analysis. Rogers did not believe in technical analysis. He firmly believed that technical analysis was completely useless in determining the future price direction of asset prices. Rogers is a perfect example of how there is more than one way to successfully trade stocks, commodities, and cryptocurrencies.
In terms of technical analysis, the vast majority of traders use this approach. It certainly seems to be the preferred method among all active traders.
Why do most traders prefer technical analysis? Because it’s much easier to obtain real-time technical indicators versus fundamental data.
Additionally, most traders believe that all the fundamental data has already been reflected in the price of the technical data. For example, price charts are considered technical analysis. The majority of traders are convinced that all fundamental data is reflected in the price charts. Consequently, they believe technical analysis supersedes fundamental analysis.
Let’s review a few of the most popular technical indicators. Chart #1 displays an upward sloping trendline for Amazon, for example.
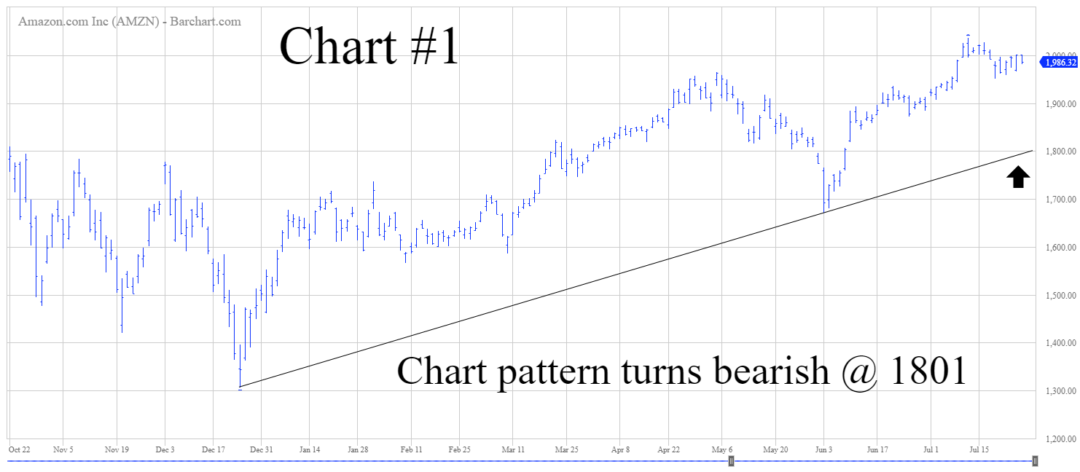
Based on technical analysis, the chart pattern will remain bullish as long as the price of Amazon stock stays above the trendline @ 1801.
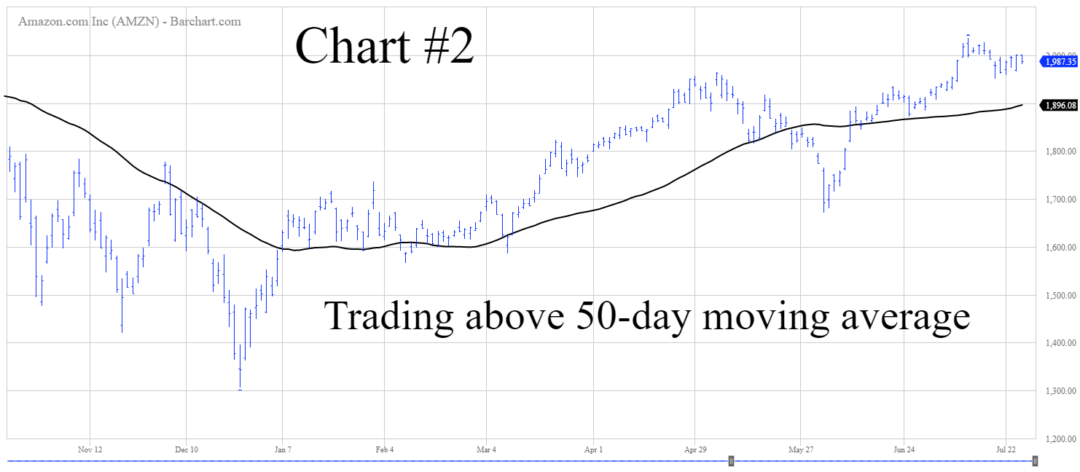
In addition to trendlines, moving averages are also quite popular in the world of technical analysis. Currently, Amazon is trading above its 50-day moving average. Please review Chart #2 below.
Arguably, the most popular indicator in the world of technical analysis is a support/resistance line. The major resistance level for Amazon is 2050 (Chart #3).

Patience and Discipline Most Important
Technical analysis and fundamental analysis have both proven to be quite helpful in allowing traders to successfully speculate in stocks, commodities, and cryptocurrencies. However, both of these trading tools are useless until traders learn how to acquire patience and discipline throughout their trading careers.
The real key to success is to teach yourself how to harness the power of patience and discipline. Your technical indicators and fundamental indicators will improve dramatically simply by learning to be a more disciplined trader.
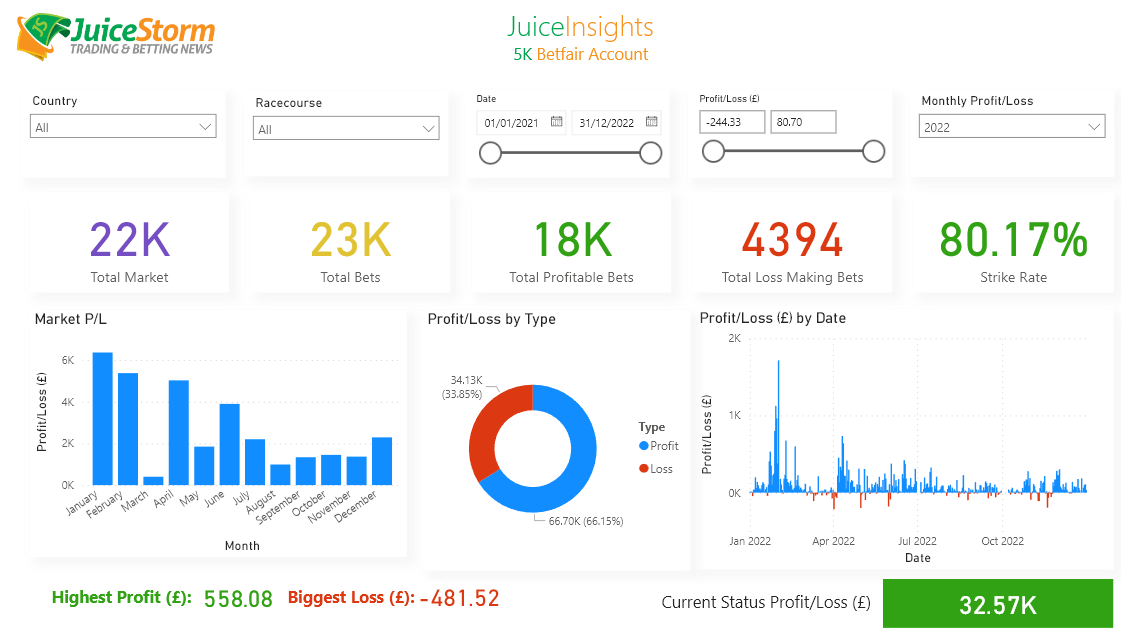
In 2021 TradeHost traded 7,937 Betfair UK, IE, US & AU horse racing and greyhound markets.
2022 saw TradeHost become even more profitable with 22,698 Betfair markets traded.
2023 less markets were traded – 17,459 – but a with a similar profit to 2022.
All trades and bets were streamed live on JuiceStorm TV which was was watched by 124,209 traders in 2022.
All results for the 48,094 Betfair markets traded are here and the charts are here.
Top 100 Comments on JuiceStorm.com

Successful Betfair Traders have the simplest Betfair Trading systems. The difference is their selection process, experience and execution level. Get that difference for yourself with automated trading by TradeHost.
