
A Look at the Best Cryptocurrency Trading Strategies
There are two different methods for speculating across all asset classes
Fundamental Analysis vs Technical Analysis
Fundamental analysis is most widely used among stock market traders, particularly those who invest in individual stocks. This particular method focuses on earnings per share (EPS), price-to-earnings (P/E) ratio, dividend yield, and debt-to-equity ratio.
The main objective of fundamental analysis is to determine the intrinsic value of the individual stock. If the price of the stock is trading below its intrinsic, an investor may want to buy the stock.
Investors use fundamental analysis with other asset classes such as bonds, commodities, and alternative investments. Regardless of the asset class, the objective is always the same–to determine the intrinsic value of the underlying asset.
If the asset is trading below its intrinsic value, the investor would be inclined to buy the security based on the fact that it’s undervalued.
Technical analysis uses a completely different method. It’s a trading approach designed to evaluate investment flows and trading opportunities by analyzing statistical trends.
These statistical trends are gathered from various trading activities, most notably price movement and volume. Technical analysis makes no effort to determine intrinsic value. Instead, it focuses on patterns derived from price movements and charting tools. These tools are used to appraise the strength or weakness of the underlying security or asset class
Although technical analysis can be used with any asset class, it is most widely used among currency and commodity traders. Why?
Because historical research suggests that currencies and commodities generate much better performance results when traders use trend-following tools commonly found in technical analysis.
Cryptocurrencies Work Best With Technical Analysis
Although cryptocurrencies have only been in existence for 10 years, technical analysis has proven to generate a better trading experience versus fundamental analysis.
Given the dramatic price fluctuations within the crypto universe, it’s virtually impossible to accurately determine the intrinsic value of any cryptocurrency, including Bitcoin. Therefore, it’s impractical to apply fundamental analysis if the intrinsic value is unavailable.
Cryptocurrencies behave in a similar manner to commodities and foreign currencies (forex). Therefore, using technical indicators is the best course of action. There are hundreds of different technical indicators. Consequently, it can be rather difficult to select the best indicators. Some simply work better than others.
Let’s review a few of the indicators that have yielded decent results trading cryptocurrencies. We’ll use Bitcoin in our examples.
Pay Attention to Volume
Volume can provide several clues to the underlying strength or weakness of the market. It can give early warning signs concerning a possible change in trend. Many traders don’t pay attention to volume. However, this is a mistake. Why? Because volume provides a “snapshot” picture of how many traders are actually establishing positions at various price levels.
The best way to use this indicator is to compare and contrast the daily volume on a big up day or a big down day. If a bullish breakout is not confirmed by record volume, it’s probably a false breakout.
Additionally, if a bearish breakout is not confirmed by record volume, the most likely outcome is also a false breakout.
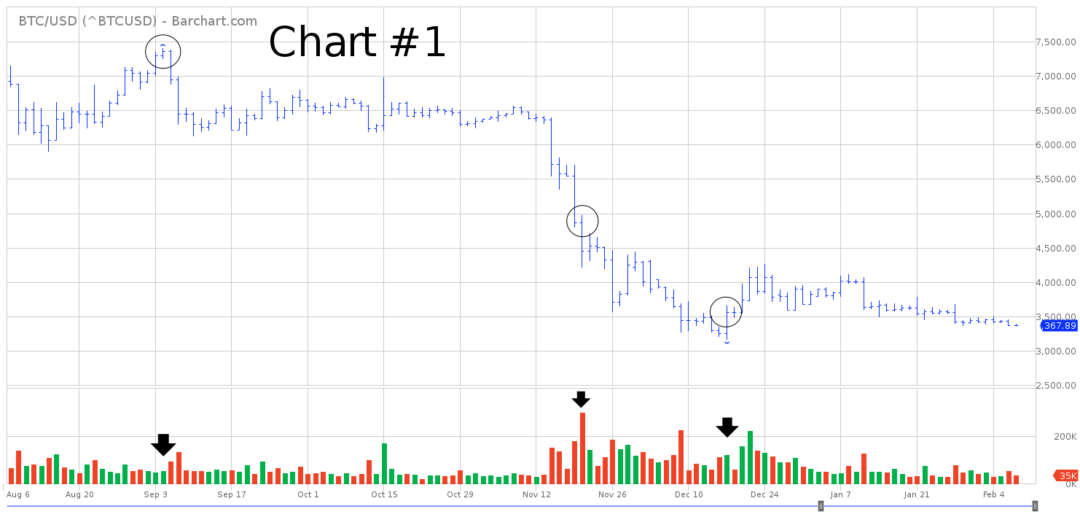
As you can see from the table above, Bitcoin generated a bullish breakout @ 7357 on September 4, 2018. However, the volume was incredibly weak @ 53,273 contracts.
This turned out to be a false breakout. The price of BTC quickly rolled over to the downside. In fact, during the past six months, BTC has never been able to trade above 7357. Traders who followed the volume indicator on September 4, were able to cut their losses very quickly.
The volume indicator produced another signal on November 20, 2018. A sell signal occurred @ 4791 on extremely heavy volume of 299,188 contracts. This was a valid signal because a new low occurred on record volume. Traders who shorted BTC @ 4791 enjoyed a very profitable trade. The price of BTC has never traded above 4791 since November 20. The volume indicator worked incredibly well on this particular trade.
A third signal occurred on December 17, 2018. The volume indicator initiated a sell signal @ 3203. However, the sell signal was not matched by record volume. Therefore, this trade resulted in a false breakout to the downside.
You will notice that Bitcoin never fell below the low achieved on December 17 @ 3158. The low was not confirmed by heavy volume. This is known as a bullish divergence. Consequently, there is a decent chance that 3158 may have marked the final bottom in the Bitcoin bear market.
As you can see, volume is a very useful tool in the world of technical analysis. You should always pay attention to volume as it has the potential to generate very profitable trades. More importantly, it can identify false breakouts, which will allow you to cut your losses very quickly. Don’t ignore volume!
Relative Strength Index
The Relative Strength Index (RSI) is a momentum oscillator that measures the speed and change of price movements. The oscillator fluctuates between 0 and 100. RSI is a fairly popular indicator which can be found on many financial websites.
Typically, traders use RSI to determine if a market is overbought or oversold. The general belief is that a market becomes overbought when RSI exceeds 70. Conversely, a market becomes oversold when RSI drops below 30. This particular strategy doesn’t work very well in the real world. Markets can remain overbought or oversold for extended periods of time. As a result, RSI tends to generate many false signals.
Based on historical research, a more appropriate way to apply RSI is to use it as a confirmation indicator. For example, if Bitcoin is making a new high, RSI should also be making a new high in order to confirm the strength of Bitcoin’s breakout into new territory.
If Bitcoin is making a new low, RSI should also be making a new low in order to confirm the strength of Bitcoin’s breakout into new territory.
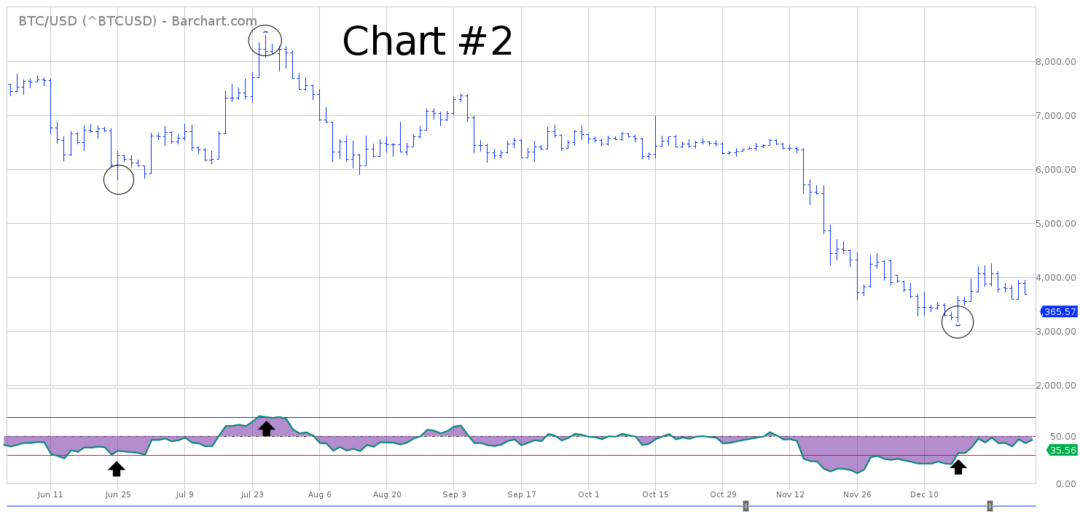
The table above displays the bearish breakout on June 25, 2018, @ 6035. RSI did not generate a new low along with the BTC price low. Therefore, this is a false breakout based on the RSI indicator. Traders who followed the RSI indicator were able to avoid a losing trade by ignoring the sell signal.
The same outcome occurred on July 25 and December 17. BTC generated a breakout based on its price level. However, RSI did not confirm the breakout. Traders who followed the RSI indicator were able to avoid a losing trade by ignoring the buy signal on July 25, and ignoring the sell signal on December 17.
The RSI indicator works remarkably well at confirming bullish and bearish breakouts. Traders who have the discipline to follow this indicator will save money by ignoring the trades that are not validated by a new RSI breakout.
Don’t Ignore Money Flow
The Money Flow Index (MFI) is a momentum indicator that measures the inflow and outflow of money into a security over a specific period of time. It uses price and volume to calculate trading pressure. Arguably, MFI is the surest way to determine the amount of money entering and leaving a particular security or market.
Similar to RSI, the index fluctuates between 0 and 100. In terms of Bitcoin, the best way to apply MFI is to use it as a validation tool. For example, if Bitcoin is making a new high, MFI should also be making a new high in order to confirm the strength of Bitcoin’s breakout into new territory.
If Bitcoin is making a new low, MFI should also be making a new low in order to confirm the strength of Bitcoin’s breakout into new territory.
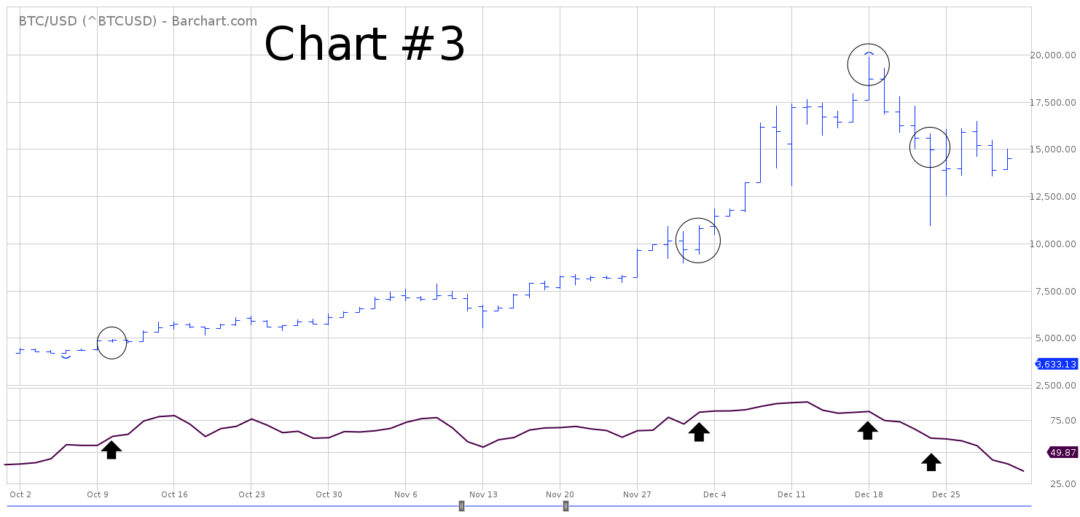
MFI confirmed the bullish breakout on October 10, 2017, and December 1, 2017. MFI did a great job of invalidating the breakout on December 18, 2017. Additionally, MFI invalidated the bearish breakout on December 22, 2017.
The Money Flow Indicator performed exceptionally well in late-2017, during the most volatile time period in the history of Bitcoin.
True Range Breakout (TRABOS)
The true range breakout indicator (TRABOS) is designed to capture short-term price fluctuations across all asset classes. It generates several buy/sell signals in comparison to most other indicators. For those who enjoy active trading strategies, TRABOS will be very appealing to your aggressive style of trading.
The most attractive aspect of TRABOS is based on the fact that it rarely misses a big move. Why? Because trading signals are calculated on a daily basis. Therefore, the indicator is constantly searching for profitable trading opportunities. See below.

Note A sell signal was generated @ 6192 on 11.14.2018
The trading rules for TRABOS are rather simple. You can find them below:
· Calculate the true range (daily high minus daily low).
· Buy signal is the closing price plus the true range.
· Sell signal is the closing price minus the true range.
· If long, the profit target is the daily high on the day of entry.
· If short, the profit target is the daily low on the day of entry.
· The protective stop is the daily high/low on the day of entry.
As you can see from the table, no signal was generated on November 13. However, a sell signal was generated on November 14, @ 6192. This turned out to be a very profitable trade because BTC experienced a substantial decline on November 14. The profit target was achieved on November 15 @ 5225.
After the trade has been completed, simply calculate a new buy/sell signal for the next day. TRABOS creates 2 to 3 trades per week. The “key” to success is to consistently take every trade for an extended period of time.
TRABOS would be a great indicator to use on the Digitex Futures platform. Why? Because TRABOS generates a large number of buy/sell signals. As Digitex is 100% commission-free, trading on Digitex will dramatically reduce the cost of trading aggressive systems like TRABOS.
Trading Strategies – Wrapping It Up
These four indicators are certainly not perfect. However, taken as a group, they provide an excellent approach to trading cryptocurrencies. Successful crypto trading is certainly possible. However, it requires patience, discipline and a handful of reliable indicators. The indicators are the easy part. The hard part is the patience, discipline, and dedication.
Personal Observations
I’ve been trading commodities for three decades. In 2016, I began trading cryptocurrencies. Throughout my trading career, I’ve used technical analysis 100% of the time.
Based on my trading results, I’m convinced that certain price patterns are repetitive in nature. I believe in the notion that past trading activity and price movements are valuable indicators of future price direction. I’m also convinced that technical analysis will generate superior results, particularly if the technical indicators are trend-following in nature.
Digitex Futures writers and/or guest authors may or may not have a vested interest in the Digitex Futures project and/or other businesses mentioned throughout the site. None of the content on Digitex Futures is investment advice nor is it a replacement for advice from a certified financial planner.
In 2021 TradeHost traded 7,937 Betfair UK, IE, US & AU horse racing and greyhound markets.
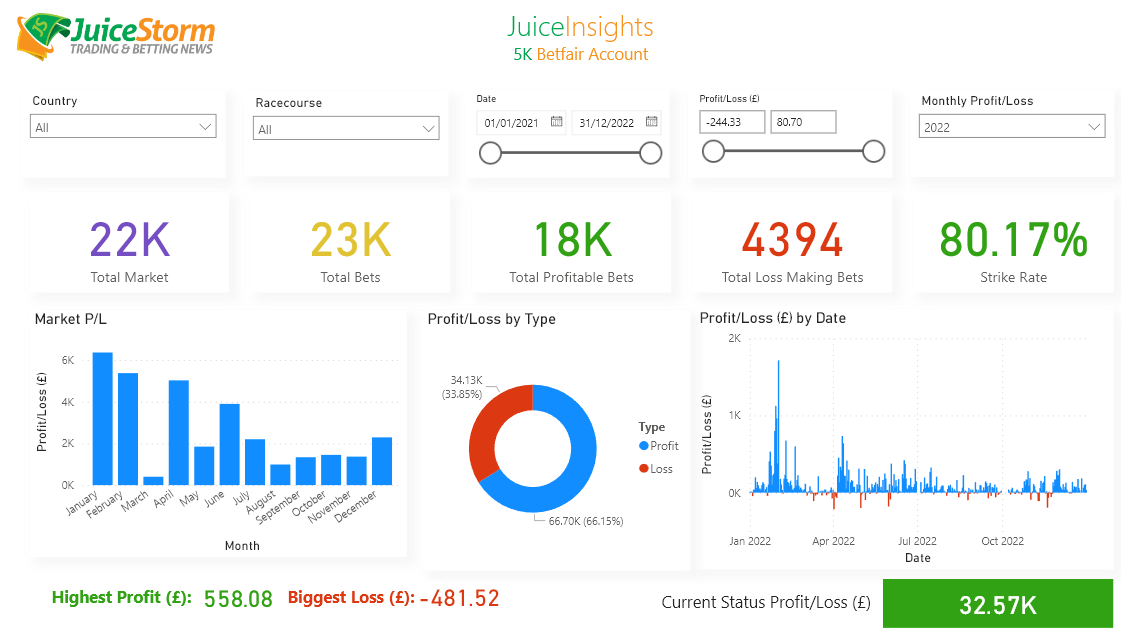
2022 saw TradeHost become even more profitable with 22,698 Betfair markets traded.
2023 less markets were traded – 17,459 – but a with a similar profit to 2022.
All trades and bets were streamed live on JuiceStorm TV which was was watched by 124,209 traders in 2022.
All results for the 48,094 Betfair markets traded are here and the charts are here.
Top 100 Comments on JuiceStorm.com

Successful Betfair Traders have the simplest Betfair Trading systems. The difference is their selection process, experience and execution level. Get that difference for yourself with automated trading by TradeHost.
