It’s Official: We Are in a New Crypto Bull Market
Why will this bull market be different
The nasty bear market in the cryptocurrency universe has finally reached its conclusion. We are in the early stages of a new cyclical bull market. The most exciting part about this new bull market is the fact that it will be completely different from the previous two crypto advances.
Cyclical Trend Versus Secular Trend
Based on the fact that Bitcoin (BTC) is the leader in the cryptocurrency space, we will focus our attention on Bitcoin. Before we begin our analysis, let’s review the difference between a cyclical bull/bear market and a secular bull/bear market.
The main difference between cyclical and secular is the time period. A cyclical trend typically lasts 3 to 6 years. However, there are times when a cyclical trend will reach its conclusion in only 12 to 18 months. This is especially true when the underlying asset is inherently volatile (in comparison to other investment vehicles in the same asset class).
Let’s review the cyclical trend of Bitcoin, dating back to its original launch in January 2009. Check out the table below.

As you can see from the table, BTC has experienced four cyclical trends since January 2009. The average length of each cycle is 2 years, 6 months. Based on this information, the current cyclical bull market will continue through June 2021.
However, please notice that Bitcoin’s cyclical bull markets are much longer than the bear markets. The average cyclical bull market is 3 years, 11 months. The average cyclical bear market is 1 year, 1 month. Consequently, we can conclude that today’s cyclical bull market could easily extend well into 2022.
In terms of Bitcoin’s secular trend, it’s safe to conclude that BTC has been in a constant secular bull market ever since Satoshi Nakamoto unveiled the cryptocurrency on 3rd January 2009. Eventually, BTC will reach a major long-term top and prices will fall for two to three decades. However, for the next 10 to 20 years, the secular trend will remain bullish.
Bitcoin Technical Analysis
The “true” bullish breakout in BTC occurred at 5,704 on 3rd May. This was the catalyst that propelled Bitcoin to much higher prices during the past 10 days.
Check out Chart number 1 below. Where do we go from here?

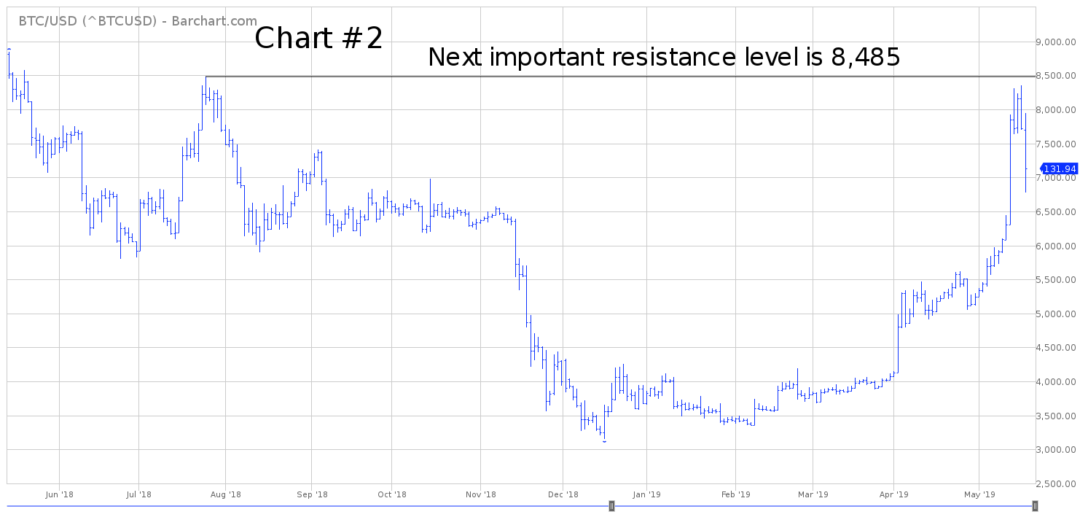
The next critical resistance level is 8,485. A weekly close above 8,485 opens the door to 9,966.
Now take a look at Chart number 2.

Many traders within the crypto community want to know if BTC will exceed its old high from 2017 @ 19,862. Of course, it’s impossible to answer this question with any degree of accuracy. However, based on the rate of advancement in the current bull market, Bitcoin could generate a new all-time as early as October 2019.
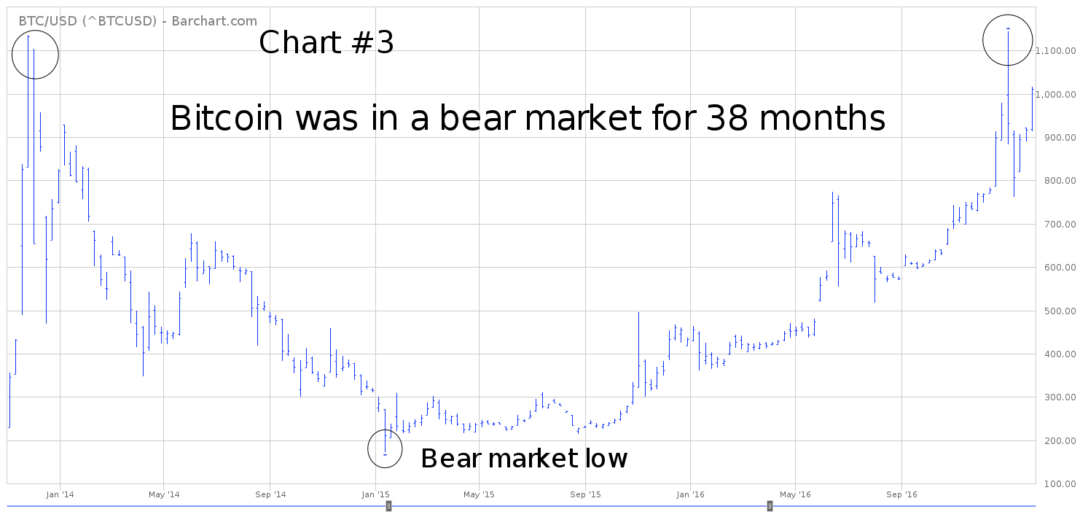
Another way to calculate the date of a new all-time high is to examine the previous cycle from peak to trough beginning in 2013. Bitcoin recorded an all-time high in November 2013 and then proceeded to enter an extended bear market.
Bitcoin spent the next three years trying to eclipse the old high from November 2013. Finally, in January 2017, BTC was able to produce a new high. Based on this analysis, Bitcoin may not be able to celebrate a new all-time high until February 2021.
The most likely scenario is that BTC will achieve a new all-time high sometime between October 2019 and February 2021 (check out chart 3 below).

This Crypto Bull Market Will Look Different From Previous Bull Markets
Officially, this is the third cryptocurrency bull market dating back to the release of Bitcoin in January 2009. These days, there is much broader participation in the use of cryptocurrencies versus 2009 and 2015. The general public is slowly beginning to accept Bitcoin (and other cryptocurrencies) as a store of value and medium of exchange. Consequently, this bull market could easily last much longer than the bull markets of 2009 and 2015.
Another reason today’s crypto advance could be different is because of volatility. Traders and investors have been actively participating in cryptocurrencies for almost 10 years. Therefore, these markets offer substantially more liquidity today versus three to five years ago.
Increased liquidity reduces volatility. Consequently, we can expect the current bull market to produce fewer dramatic price movements along with more sideways trading activity.
10 years from now, when we look back and examine today’s bull market, we will probably reach the conclusion that the 2019 cryptocurrency bull market offered a much better trading environment versus the previous advances. This bull market will go down in the history books as the time when cryptocurrencies officially became listed as a major asset class!
Bitcoin Update – Last 48 Hours
Despite the sharp decline during the past 48 hours, make no mistake, BTC is still in the early stages of a new bull market. Bitcoin was extremely overbought. Therefore, the cryptocurrency was vulnerable to a sharp sell-off.
Notice how the rally ended just below the important resistance level @ 8,485 (Chart #2). This is a perfect example of how important these resistance levels can be. The crypto trading community pays very close attention to these numbers.
Digitex Futures writers and/or guest authors may or may not have a vested interest in the Digitex Futures project and/or other businesses mentioned throughout the site. None of the content on Digitex Futures is investment advice nor is it a replacement for advice from a certified financial planner.


